Introduction
In this project we study the large scale adjustment of the atmosphere to the seasonal cycle in heating and cooling due to the following processes. (1) absorption and emission of long wave radiation by greenhouse gases; (2) absorption of solar radiatio by ozone, water vapour and the Earth's surface; (3) phase changes of water, principally evaporation at the Earth's surface and latent heat release in very deep clouds in the tropics; (4) meridional transport of heat and momentum due to eddies (deviations from the zonal mean). The changes in the compostion of the atmosphere have a profound influence on this adjustment. Increasing the greenhouse gas concentrations in the stratosphere changes the energy budget in the stratosphere because the cooling rate of the polar night winter stratosphere increases with increasing greenhouse gas concentrations. Preliminary model (PeN-model) calculations (neglecting the effect of phase changes of water) indicate that this leads to a larger amplitude positive potential vortcity anomaly over the pole with a stronger polar night jet. There are strong indications that this might in turn affect the circulation in the troposphere, i.e. induce a stronger westerly jetstream and enhanced baroclinicity in the troposphere. Presently we focus on the question how the zonal average potential vorticity (PV) distribution is established by the above mentioned processes. The PV-distributions can be related to all other variables (wind, temperature, etc.) through PV-inversion. Numerical modelling and the technique of "Piecewise PV-inversion) is employed to separate the influence of different mechanisms.
Potential vorticity and Arctic Oscillation Index
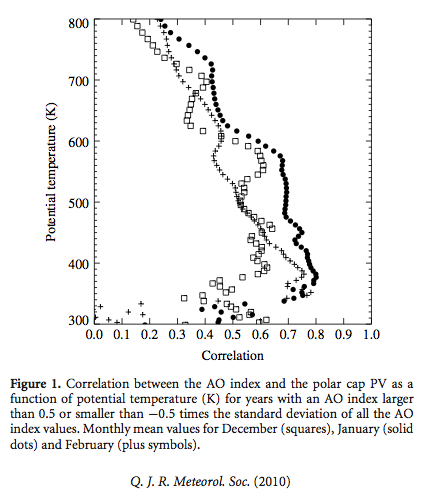
We have written a paper on the relation between the AO-index (AO-index) and the zonal average potential vorticity distribution in the stratosphere in the northern hemisphere winter. The novel step that is made is the following. The zonal average PV-field is partitioned into two parts: one part (called "the reference state") is associated with the state of rest, while the second part (the anomaly) is associated with the circumpolar wind, which can be retrieved by inverting the PV-anomaly. Using ERA-40 reanalysis data we find two separate (in space) PV-anomalies: a positive PV-anomaly in the stratosphere above 450 K and another positive PV-anomaly in the upper troposphere and lower stratosphere (below 425 K). The latter PV-anomaly, which we call "the extratropical UT/LS-PV-anomaly", or "Ex-UTLS PV-anomaly" is associated with the tropopause and is manifest relatively strongly in the static stability (or isentropic mass density). The amplitude and shape of both these PV-anomalies depends significantly on the phase of the AO-index. By piecewise PV-inversion we find that the lower anomaly has a strong effect on the vertical shear of the zonal wind, and therefore on the baroclinicity of the upper troposphere and lower stratosphere. It also induces the subtropical jetstream. The stratospheric PV-anomaly induces the stratospheric polar night jet. The results of this study have been published in a paper (Hinssen et al., 2010). Results that are connected to this paper were presented at the SPARC meeting in Bologna in September 2008, at the EMS meeting in Amsterdam in October 2008 (poster1 and poster2), at the Royal Met. Society meeting in Reading in June 2009 and at the AGU-meeting in San Francisco in December 2009.
The figure below shows the correlation in time between AO index and the polar cap potential vorticity for the three northern hemisphere winter months (from Hinssen et al., 2010).
How is the PV-distribution established? The influence of radiation
The question now is the following. What mechanisms are responsible for the formation, amplitude and shape of the two zonal mean PV anomalies? The principal candidates are listed above. We have developed a "simplified" two-dimensional (height-latitude) primitive equation model of the zonal mean state and its evolution that captures these mechanisms (the effect of the eddies is of course "strongly parametrized"). An impression of the results obtained with a first version of the model can be obtained from the following movie, which shows the zonal mean wind velocity, the zonal mean temperature and the zonal mean potential vorticity as a function of latitude and pressure (1000-3 hPa) during one year. Absorption of Solar radiation by ozone is taken into acount. There are types of greenhouse gases: water vapour and carbon dioxide. In this simulation, which was performed in June 2011 water phase changes are neglected. The vertical dependence of the water vapour density is based on the water vapour scale height and the prescribed relative humidity at the earth's surface.The relative humidity at the Earth's surface is assumed to be 30% at all latitudes. The meridional circulation is driven by Solar heating, the greenhouse effect of water vapour, which is much stronger in the tropics than in the polar latitudes, and wave drag in the upper troposphere and lower stratosphere. The energy transformations associated with phase changes of water are included in a strongly simplified way (see below).
(movie) (file of 3 Mb)
This movie shows the zonal average zonal wind (black), the potential temperature (cyan), the wave drag (red) and the dynamical tropopause (green), in the second year of simulation starting with an isothermal atmosphere at rest. The formation in the winter hemisphere of the polar night vortex can be observed, as well as the transition from a cyclonic vortex to an anticyclonic vortex in late spring. The model produces the Ex-UTLS PV-anomaly and the associated subtropical jetstream. The subtropical jetstream in winter is stronger than the subtropical jetstream in summer, as is observed in reality. Also observed is the cold tropical tropopause (the upward bulging 370 K isentrope).
The next challenge is to perform three-dimensional simulation and to investigate the explicit effect of eddies in the troposphere and lower stratosphere.
How is the PV-distribution established? The influence of the water cycle
Including the energy transformations associated with the water cycle (latent heat release in clouds and cooling at the surface due to evaporation and the interaction of radiation with clouds) is extremely complex, because the model must accurately represent the seasonal cycle of the water vapour- and cloud-distribution. The evaporation at the Earth's surface is calculated from the surface sensible heat flux and the prescribed Bowen ratio. The evaporated water is instantly in balance with total precipitation. The distribution of precipitation is prescribed. First results indicate that latent heat release is important because it intensifies the existing wind features, i.e. the subtropical jetstream. Howver, it does not determine the existence of the important PV-anomalies. Wave dragdtermines these PV-anomalies and also determines the wind reversal in the stratosphere in spring.
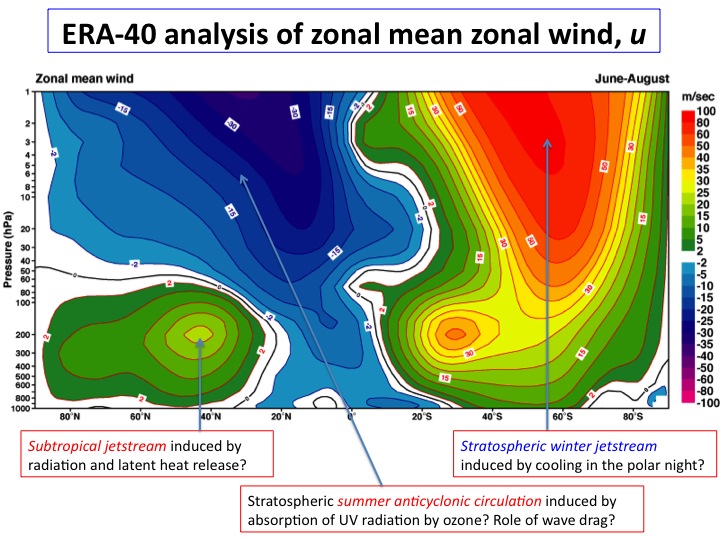

The upper figure shows the ERA-40 analysis of the zonal average zonal wind for the southern hemisphere winter (Source: ERA-40 Atlas). The figure below shows a solutions of the two-dimensional (latitude/height) primitive equation model (PeN-model) for day 160 (June 10), just after the wind reversal in the northern hemisphere stratosphere. The stratospheric jet in the southern hemisphere is separated from the core of the subtropical jet, as observed. In the tropics the wind is from the east (E indicates wind from the east; W indicates wind from the west) above 500 hPa. At lower levels the wind is from the west at latitudes between 25 deg N and 0 deg N. This is because air in the lower troposphere travels from the southern hemisphere to the northern hemisphere in the "winter" Hadley cell and is deviated towards the west by the Coriolis force after passing the equator, as is observed over the Indian Ocean during the Monsoon (June-August). The temperature at the earth's surface is about 15 K too low, but the general pattern with cold tropics between 300 hPa and 100 hPa agrees with observations.
How is the PV-distribution established? The influence of breaking planetary waves
With the "dynamical core" 3D version of the primitive eqaution model (no parametrizations, but including nearly all effects of the curvature of the Earth's surface), a simulation of a baroclinic life-cycle (spanning a period of 12 days) was performed. The research focusses on the wave-breaking stage after t=144 hours. Here is a movie of a simulation of Rossby wave breaking at 300 hPa. The upper boundary of the part of the domain shown corresponds to 63°N; the lower boundary of the part of the domain shown corresponds to 27°N. The domain is periodic in the west-east direction (towards the right) and spans a 60° interval in this direction (Note: convergence of the meridians is taken into account). The model has 36 layers of equal mass.
(movie) (file of 7 Mb)
The movie shows the evolution over 12 days of a wave in the jetstream at approximately 300 hPa from small amplitude initially to large amplitude and eventual breaking after about 7 days. This is an example of a so-called LC1 life cycle. The interesting aspect of this simulation is that a surf-zone is formed after 200 hours (about 8 days) flanked by two jetstreams. This is presumably due to the mixing of potential vorticity (PV) associated with the breaking of the wave and the formation of a "potential vorticity staircase". This staircase corresponds (through PV-inversion) to thin fast eastward jets at the latitudes of steepest PV-gradients (see the article in Science by Baldwin et al., (26 Jan. 2007, vol 315 p. 467). The formation of the second jet at the southern edge of the surf-zone can be observed in the following movie. It shows the zonal mean zonal velocity as a function of latitude and height between t=0 and t=288 hrs.
(movie) (file of 7 Mb)
The plan is to repeat the stage of the evolution of the wave-breaking after t=144 hrs with aan increased domain size, i.e. spanning 360° lon. instead of 60° longitude, in order more accurately allow for wave dispersion effect. Also, the effect of realistic radiative damping will be subject of research.
References
Y. Hinssen, A. van Delden, J. Opsteegh and W. de Geus, 2010: Stratospheric impact on tropospheric winds deduced from potential vorticity inversion in relation to the Arctic Oscillation. Quarterly Journal of the Royal Meteorological Society, 136, 20-29. see pdf . See also the corrigendum: Quarterly Journal of the Royal Meteorological Society, 136, 2203-2204. see pdf .
Y.B.L. Hinssen, and M.H.P. Ambaum, 2010: Relation between the 100 hPa heat flux and stratospheric potential vorticity. J.Atmos.Sci., 67, 4017-4027. see pdf
Y.B.L. Hinssen, 2010: The impact of the stratosphere on tropospheric climate. PhD-thesis, Utrecht University. See igitur
Y.B.L. Hinssen, A. van Delden and J. Opsteegh, 2011: Influence of sudden stratospheric warmings on the tropospheric winds. Meteorologische Zeitschrift. 20, 259-266. see pdf.
Y.B.L. Hinssen, C.J. Bell and P.C. Siegmund, 2011: Change in the influence of the stratosphere on the troposphere due to CO2 doubling obtained from potential vorticity inversion. Atmospheric Chemistry and Physics, 11, 4915-4927. see pdf.
Y.B.L. Hinssen, A. van Delden and J. Opsteegh, 2011: The seasonal cycle of the stratospheric potential vorticity distribution. Revised manuscript submitted for publication.
A.J. van Delden and Y.B.L. Hinssen, 2012: PV-theta view of the zonal mean state of the atmosphere. Tellus A 2012, 64, 18710, http://dx.doi.org/10.3402/tellusa.v64i0.18710.pdf.
Poster presented at the WCRP-conference in Denver on October 24, 2011: pdf.
Participitants in this project at IMAU
Theo Opsteegh, Yvonne Hinssen, Wouter de Geus, Niels Zweers, Roos de Wit, Fabien Chatterjee-Mars, Aarnout van Delden.
Acknowledgements
Maarten Ambaum and Chris Bell (both at the University of Reading, UK) and Peter Siemund (KNMI) have contributed to this project. During Yvonne's visit to Reading in June 2010, Chis Bell died after being hit by a car. He was only 27 years old (obituary).
Wouter de Geus is now working as a meteorologist in Belgium, Niels Zweers doing a PhD project at KNMI and Yvonne Hinssen is now at MeteoConsult, after obtaining a PhD-degree in December 2010.