News
Save the date of 11 May 2023 (14:00-19:00): Farewell symposium on Connecting Data and Theory"
Essay: Connecting Data and Theory
19 November 2021: NVBM Award 2021 for "operational meteorology"
9 August 2021. Today's will not fall tomorrow, but when will it?
25 May 2021. The Science of Extreme Weather: the lost connection between data and theory
16 May 2019. Shifting Seasons
Lente en winter schuiven (in Dutch)
19 April 2018. Workshop on the Northern Annular Mode
ReportNAM-Workshop19042018.pdf
SecondAnnouncementWorkshop19042018.pdf
20 May 2016. Unlikely high temperatures in December 2015
16 March 2015. Simulation and Understanding
SimulationAndUnderstanding.pdf
25 June 2014. Will El Niño disrupt Pacific trade winds in the second half of 2014?
TakingAdvantageOfTradeWinds.pdf
9 June 2014. A severe thunderstorm
On Monday June 9, Michiel Baatsen, Lars Tijssen and Arjen van Beelen go storm chasing and encounter a severe storm near the border between the Netherlands (Limburg) and Germany. At 18:30 UTC Michiel Baatsen catches a beautiful shelf cloud/"bow echo" approaching Tilz in Germany. Wind gusts of more than 140 km/hr caused much damage and some casualties in this region.
11 February 2014. Very mild winter in Western Europe
27 November 2013. A severe storm hits The Netherlands
The isallobaric effect during the storm of 28 October 2013 (in Dutch) Storm28Okt2013.pdf
22 May 2013. Cold weather in March 2013
Record high pressure over North Pole in March 2013: HighPolarPressureMarch2013.pdf
10 September 2010. Global warming confirmed
Message from ECMWF: "Reanalysis confirms record warmth".http://www.ecmwf.int/publications/cms/get/ecmwfnews/263.
1 March 2010. Cold winter weather associated with negative zonal index
"Coming in from the Cold: This Winter in Review with Dr. Aarnout van Delden": pdf
9 December 2009
Richard Kerr in Science of 2 October 2009: "What happened to global warming? Scientists say: just wait a bit".
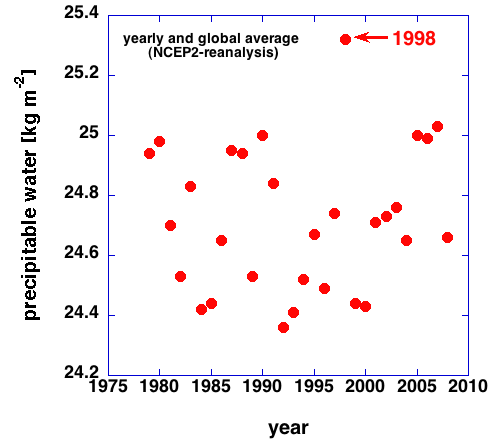
Many "climate sceptics" are using the graph shown below to underline their belief that global warming is fiction. The year 1998 was, indeed, the warmest year. After 1998 the globally averaged temperature has not increased, despite increasing carbon dioxide concentrations.
Why was 1998 such a warm year? This may have to do with the very high globally average water vapour content in 1998 (see second figure below). Water vapour has a stronger greenhouse effect than carbon dioxide!
Why was there so much water vapour in the atmosphere in 1998? This is an interesting question, which is well worth investigating. Some investigators refer to the strong El Niño of 1997-1998. However, this implies that other El Niño years, such as 1982-1983, should exhibit high water vapour contents also. This is not the case.
The water vapour content in the atmosphere is determined strongly by the circulation in the atmosphere and in the ocean. There is still a lot that is unknown about the interaction between the water cycle and the atmospheric and oceanic circulation!
Furthermore, the ocean can easily absorb all the excess heat that is "generated" by the enhanced greenhouse effect (globally averaged this about 0.9 Watts per square metre). Unfortunately, heat uptake by the ocean is not measured accurately.
Coming back to the first figure below: note that the global average temperature did not change much between the years 1987 and 1997 either.
CREDIT: ADAPTED FROM J. KNIGHT ET AL., BULL. AMER. METEOR. SOC., 90 (SUPPL.), S22--S23 (AUGUST 2009) by Science (2 October 2009: Vol. 326. no. 5949, pp. 28 - 29).
Snow-alert of 8 Feb. 2007: Sneeuw08022007.pdf
IPCC-discussion (13 Feb. 2007): IPCCDiscussie.pdf
Web-sites
SURFACE WEATHER MAPS
From Canada (UQAM): Atlantic+Europe, Benelux, Canada,