Abstract
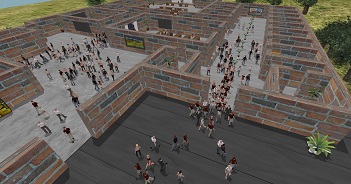
The quantification of pedestrian safety is an important research topic. If reliable quantification is possible, it can be used to predict and prevent dangerous situations, such as the crowd crush at the 2010 Love Parade. To quantify safety, we can use several metrics like density, velocity, flow and pressure. Unfortunately, there are several methods to evaluate these metrics, which may give different results. This can lead to different interpretations of similar situations. Researchers compare these metrics visually or search for trends in fundamental diagrams. This is inherently subjective. We propose an objective methodology to compare these methods, where we emphasize the different quantifications of peak 'dangerousness'. Furthermore, we refine existing methods to include the obstacles in environments by replacing the Euclidean distance with the geodesic distance. In our experimental analysis, we observe large differences between different methods for the same scenarios. We conclude that switching to a different method of analysing crowd safety can lead to different conclusions, which asks for standardisation in this research field. Since we are concerned with human safety, we prefer to err on the side of caution. Therefore, we advocate the use of our refined Gaussian-based method, which consistently reports higher levels of danger.
References
-
Arne Hillebrand, Han Hoogeveen and Roland Geraerts. Comparing different metrics quantifying pedestrian safety. Will appear in Pedestrian and Evacuation Dynamics, 21-24 August 2018 (Lund, Sweden).

-
Arne Hillebrand, Han Hoogeveen and Roland Geraerts. Measuring pedestrian safety. Poster in ICT.OPEN 2018, ASCI track (Amersfoort, The Netherlands).
Methods
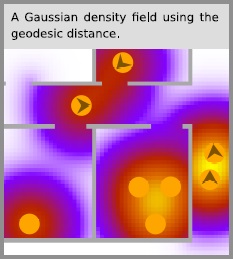
We compare grid-based, Voronoi-based and two Gaussian-based methods, which use the Euclidean distance. A shortcomming when using the Euclidean distance us that obstacles are not taken into account. We propose to use the geodesic distance.
In the figure below, the orange disk represents pedestrians. Figure (a) shows Fruin's classical density. The cells measure 1x1 meter. In (b) and (c) is the Voronoi diagram-approach by Steffen and Seyfried is shown, next to the geodesic Voronoi diagram. (d), (e) and (f) show the Gaussian-based density measure by Helbing et al. with sigma = 1m, the proposed method by Paue et al. and a Gaussian density measure using the geodesic distance.

Different density fields.
Comparing metrics
Researchers often look at trends in fundamental diagrams or search for visual differences. This makes a proper statistical analysis difficult. Therefore, we look at four different analyses that make statistics analysis possible.
Besides the maximum and maximum difference, we define two new analyses. The quadratic score can be used when two metrics give similar maxima. It calculates a characteristic score which emphasizes large differences with the maximum values.
A measured value can be mapped to a specific value. One such mapping is the Level of Service. The difference between these values results in the bin-distance.
Results
We tested the different metrics on three building blocks for environments and varied the number of pedestrians. We show the resulting analyses of density for one environment. We conclude that there are significant differences at the 95% confidence level.