Graph Layouts by t-SNE
Problem
Drawing graphs typically entails computing 2D coordinates for their nodes, a process known as layout. Doing this for very large graphs is however complicated and slow. Separately, drawing high-dimensional datasets typically entails extracting 2D coordinates from their samples, a process known as projection or dimensionality reduction (DR). Given the similarity of the above two processes, can we use DR to lay out large graphs?
tsNET
We explored the above idea by constructing the graph layout engine tsNET, which works as follows. We first reduce a graph to a matrix encoding the shortest-path distances between all node pairs in the graph. Next, we adapt the well-known t-SNE projection method to embed the graph nodes in the 2D space. Finally, we draw the graph using a mix of straight lines and edge bundles.
Results
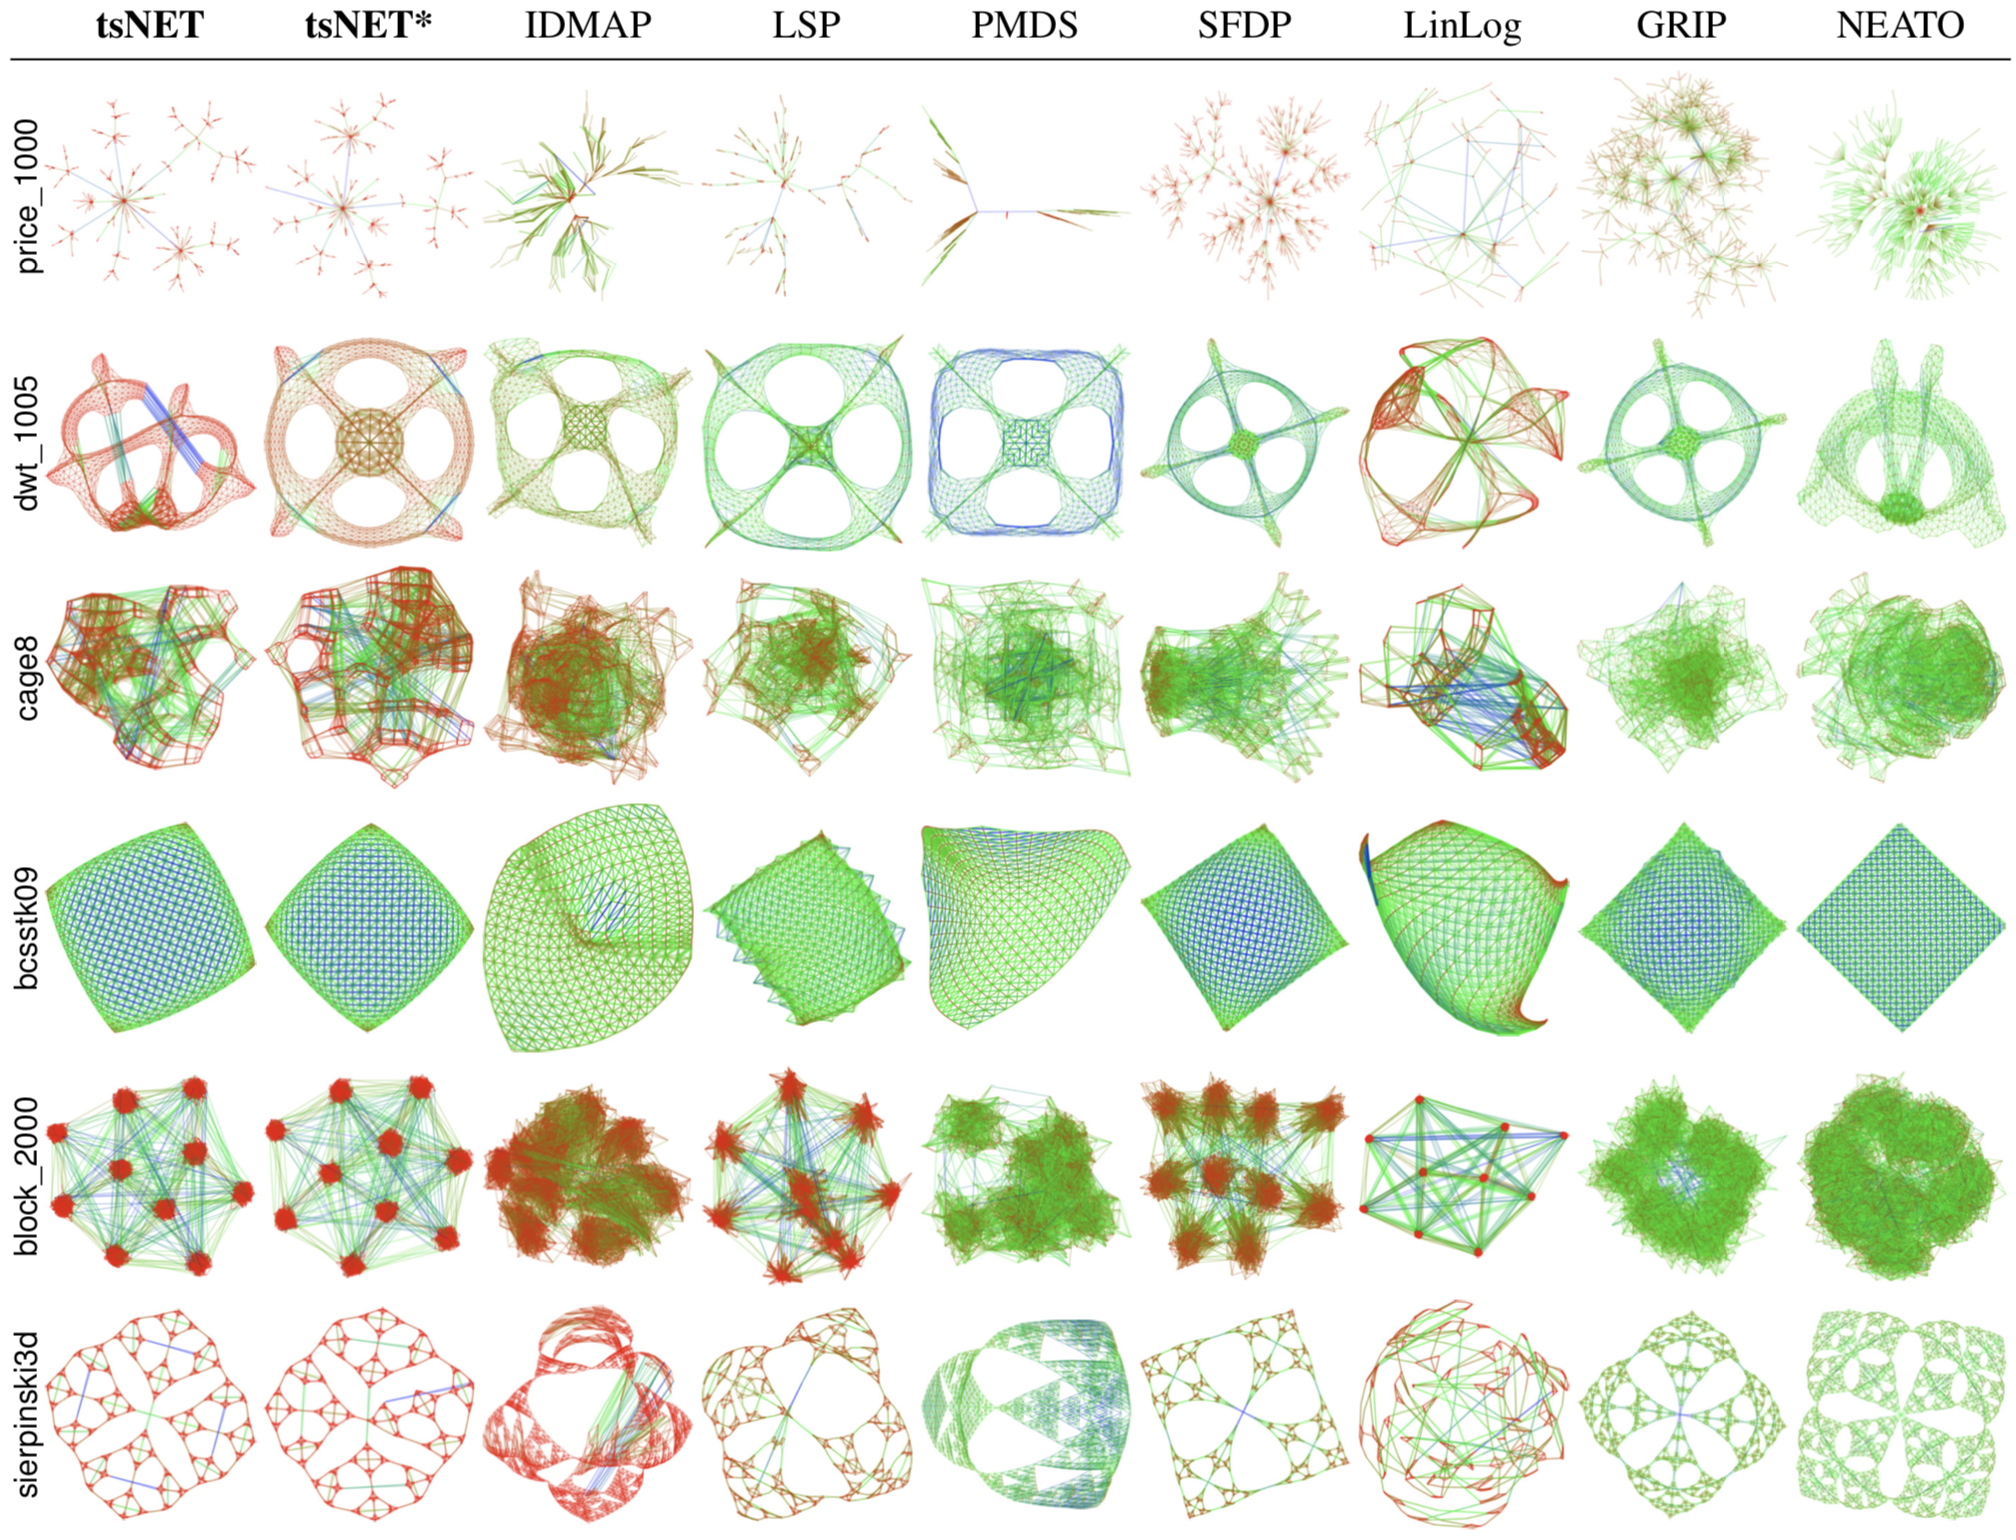
We compared tsNET with seven state-of-the-art graph layout methods (IDMAP, LSP, PMDS, SFDP, LinLog, GRIP, NEATO) on a wide range of graphs, such as trees, grids, small-world, random, regular, ranging from a few hundred to over 13000 edges. The image below shows the results. The leftmost two columns show the results of tsNET and a variant thereof, tsNET*. As visible, our method yields results which are at least as aesthetically pleasing as those produced by the compared methods.
Quality
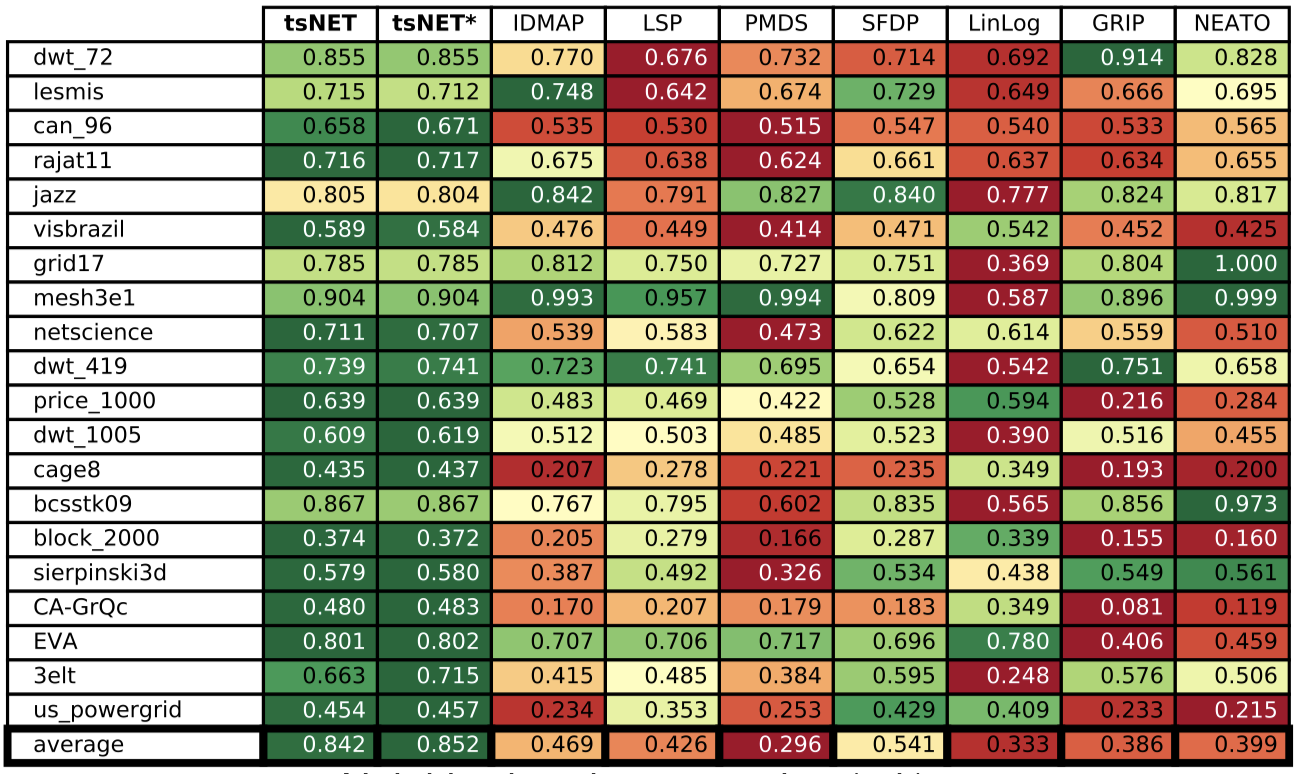
We also compared tsNET quantitatively with other layout methods by measuring various quality metrics. The image below shows one of these (neighborhood preservation). High values (green) indicate better layouts. The leftmost two columns (tsNET,tsNET*) score the best results over all the tested graphs.
Bundling
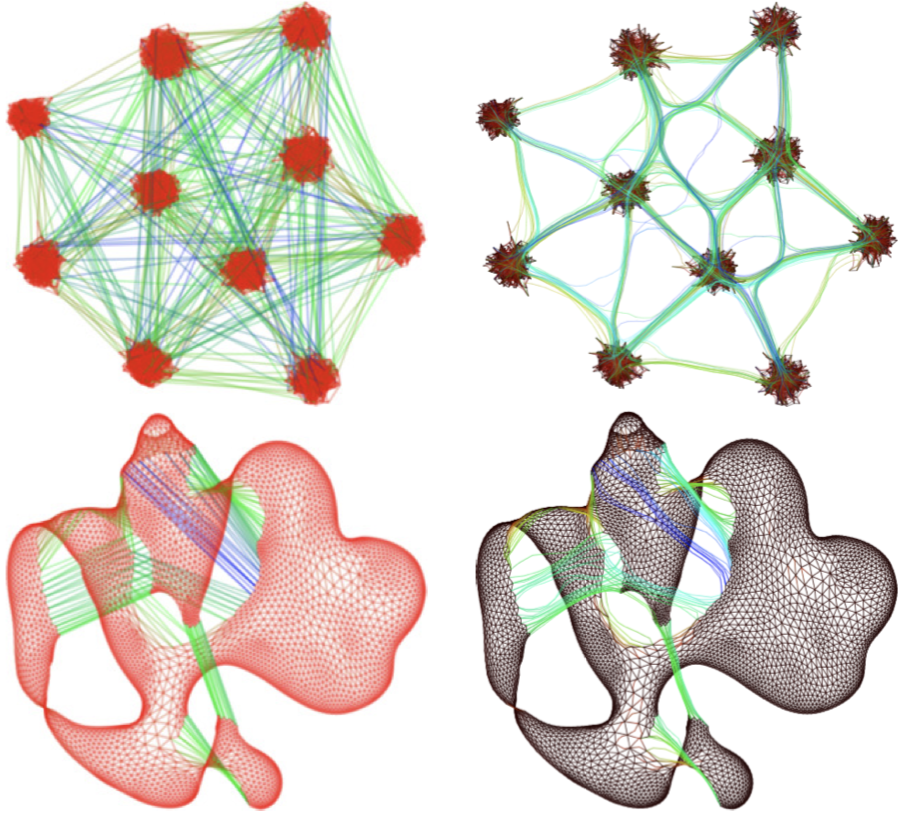
The image below shows how bundling can be used to improve the readability of tsNET layouts. In the right pictures, long edges have been bundled, thereby reducing their occlusion of the edges they cross over. Compare with the left pictures which use classical straight-line drawing.
Software
tsNET is distributed as open source here.
Publications
Graph Layouts by t-SNE J. Kruiger, R. Martins, P. Rauber, A. Kerren, S. Kobourov, A. Telea. Computer Graphics Forum (Proc. EuroVis), 2017