Doing empirical research with the help of Netlogo and R
Gerard Vreeswijk
Introduction
Empirical research is research by doing experiments.
It turns out that it is extremely easy to organise AI experiments with the help of Netlogo and R.
Netlogo and R
- Netlogo is an AI environment targeted towards high school students, university students, and academic researchers. Netlogo is exceptionaly well suited for prototyping, researching and showcasing ideas in AI. Because of its educational offspring, Netlogo has a gentle learning curve. To help learning Netlogo, Netlogo's installation is accompanied by hundreds of example programs to learn from (
<Ctrl+M>). Netlogo's official documentation (<F1>) is concentrated on one place and one one place only. This documentation is extremely accessible, comprehensible, complete, and accurate. Probably Netlogo's accurate documentation explains why there is little secondary documentation in the form of questions/answers on user fora or books. There are questions/answers on user fora, but not too many.
Because everything is so easy in Netlogo, many scholars who have heard of Netlogo suspect it is slow. This is not true. Netlogo contains a sophisticated interpreter that has been highly optimised. When experiments are run in batch, Netlogo is even faster because in that case Netlogo utilises all CPU cores.
- R is statistical software that is the de facto standard for serious statistical research. It is a tool made by, and made for, academic researchers. R has a steep learning curve, which probably explains why there is plenty of secondary literature out there to help out end-users.
Behaviour space
Although Netlogo and R come from different cultures they can be made to work together in a productive way.
To begin with, Netlogo faciliates the organisation of experiments by means of something that is called BehaviorSpace. Netlogo's BehaviorSpace is an empty suite that can be filled with experiments. Each experiment is a collection of runs. This collection of runs is the result of asking Netlogo to run your program with different parameter settings. In doing so the different program instantiations run parallel on all CPU cores and no output is visible. Further explanation on Netlogo's BehaviorSpace can best be taken from Netlogo's manual itself.
Save as table
When you ask BehaviorSpace to execute an experiment, it asks you how to save its output. In doing so it offers two options, viz. “spreadsheet output” and “table output”. By default, “spreadsheet output” is ticked and “table output” is not ticked. Since I always use table output for further statistical processing, I un-tick “spreadsheet output” (for efficiency) and tick “table output” (for results). Then, Netlogo asks you to come up with a file name that ends in .csv (comma separated value) to store the table in. Say you choose my_results.csv. After the experiment has ended, my_results.csv might look like this:
"BehaviorSpace results (NetLogo <version>)"
"<name of your netlogo program>.nlogo"
"<name of your experiment>"
"<date and time experiment was executed>"
"min-pxcor","max-pxcor","min-pycor","max-pycor"
"0","11","0","11"
"[run number]","[step]","independent-1","independent-2","dependent"
"1","1000","94","43","3.4413"
"3","1000","93","42","2.5244"
"4","1000","97","40","1.4333"
"2","1000","94","43","3.3132"
"6","1000","89","21","1.1313"
"5","1000","97","40","1.7511"
....
and so forth
Let me explain the structure of this table somewhat. The first 6 lines (line 6 is "0","11","0","11") are not interesting for statistical processing. Line 7 and further represent the actual table of experiment results. Line 7 contains the header of this table: run number surrounded by brackets because it is system provided information, step number (also system provided information), two input variables “independent-1” and “independent-2” and one output variable “dependent”. So for example nr. run 2 stopped at step 1000, and the values of the input and outputvariables are 94, 43, and 3.3132, respectively. The run numbers do not monotonically increase because runs excute in parallel (at least when you ask for it). In our case, run nr. 1 finished first then run nr. 3, then run nr. 4, and so on.
The present table may then be further processed by R.
R
A typical R script to process the table above looks like the following:
#!/usr/bin/Rscript -w

my_data = read.csv("my_results.csv", skip=6) # Read comma separated Netlogo output
                                             # and ignore the first 6 lines.
                                             # Always ignore the first 6 lines of Netlogo table output.

pdf("my_results.pdf") # Write results in PDF format.  Many other formats are possible.

# Do interesting things with 'my_data'.  Then produce nice plots of these results which will
# then automatically written to 'my_results.pdf'.

dev.off() # Finalise PDF
I have assumed that you have installed R and Rscript is in your path. Of course the “do interesting thing with my_data” part needs further clarification, so here is an elaborated example.
A worked example
In this example, we will add an experiment to an existing Netlogo program, run this experiment, process the results in R, and make a nice plot.
-
Open Netlogo, and press
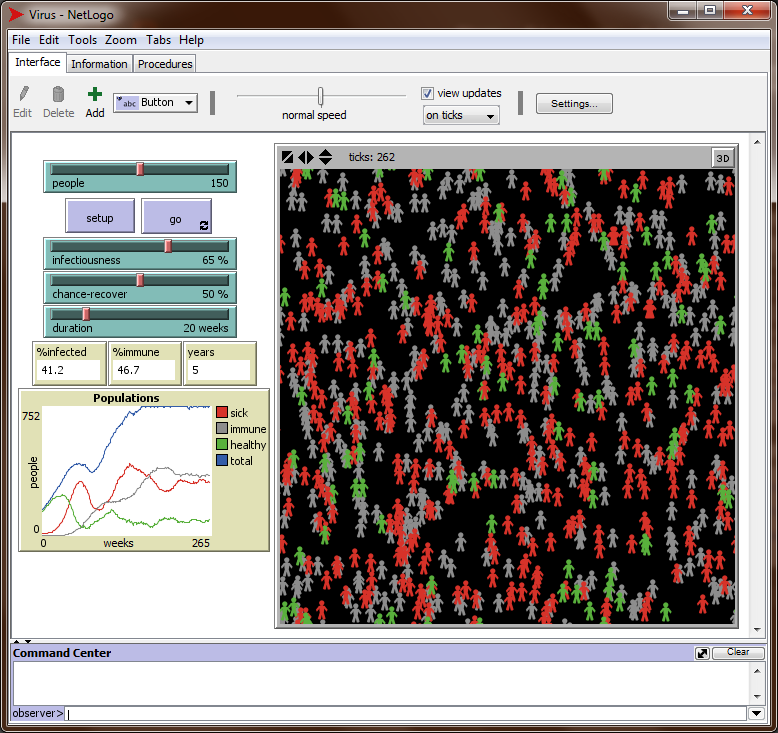
<Ctl+M> to open the models library. Type “Virus” in the search box below to find the Netlogo program “Virus.nlogo” in the biology section (not in the network section). Open that program by double-clicking it. Check what it does (this takes some time!) and run it a few times. You should see something like this:
-
Save “Virus.nlogo” under a different name, for example under the name “Virus Experiment.nlogo”. You also might want to save your own copy into a different directory (folder).
-
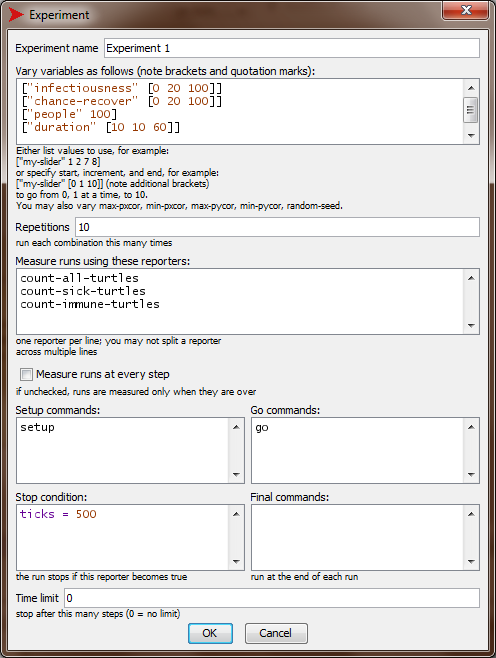
In this newly saved program, press
<Ctrl+Shift+B> to open BehaviourSpace. Create a new experiment and name it “Experiment 1”. See how BehaviorSpace suggests variable parameters and parameter ranges by picking them up from the variables and variable ranges that defined at the input widgets?
Fill out this new experiment as follows.
Be sure to unceck “Measure runs at every step”. Otherwise Netlogo will write results at EVERY step of the simulation, which in our case would give very large result files. We are interested in end results only.
-
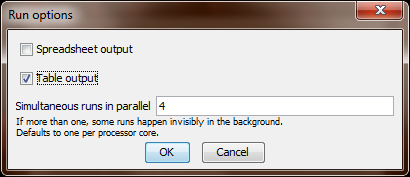
Save and run the experiment. Behaviorspace will then ask you in which format(s) you want to save the results. Tick “table” and un-tick “spreadsheet”, because in our case we want a file in which each line summarises the result of one run.
After confirmation, BehaviorSpace will suggests a file name to save the table in. The suggested name “Virus Experiment-table.csv” is just fine. Now Netlogo runs your experiment.
-
The resulting file “Virus Experiment-table.csv” starts like this:
"BehaviorSpace results (NetLogo <version>)"
"Virus Experiment.nlogo"
"Experiment 1"
"<data and time>"
"min-pxcor","max-pxcor","min-pycor","max-pycor"
"-17","17","-17","17"
"[run number]","infectiousness","chance-recover","people","duration","[step]","count-all-turtles","count-sick-turtles","count-immune-turtles"
"3","0","0","100","10","500","750","0","0"
"4","0","0","100","10","500","750","0","0"
"2","0","0","100","10","500","750","0","0"
"1","0","0","100","10","500","750","0","0"
"5","0","0","100","10","500","750","0","0"
"6","0","0","100","10","500","750","0","0"
"7","0","0","100","10","500","750","0","0"
...
and so on
The table structure of Netlogo's output was already explained, see above.
-
Now R comes to the stage. We can let R do anything we want with the data in “Virus Experiment-table.csv”, but let us suppose we want to investigate how sickness depends on infectiousness under varying duration (dr) and chances of recovery (cr):
#!/usr/bin/Rscript -w

mydata = read.csv("Virus Experiment-table.csv", skip=6) # Read comma separated Netlogo output
                                                        # and ignore the first 6 lines.
                                                        # Always ignore the first 6 lines of Netlogo table output.

aggregated = aggregate(cbind(                                   # Per parameter combination (infectiousness,
   count.all.turtles, count.sick.turtles, count.immune.turtles  # chance.recover, people, duration) multiple runs
)                                                               # are performed.  Aggregate for each combination.

   ~ infectiousness * chance.recover * people * duration, data=mydata, FUN=mean) # Aggregate by taking the mean.

#X11()                                 # Uncomment when you want your result in a GUI
#pdf("Virus Experiment-table.pdf")     # Uncomment when you want your result dumped as *.pdf
png("Virus Experiment-table.png",      # Uncomment when you want your result dumped as *.png
             width=1200, height=1200)  # Use enough width to create pics with enough resolution.

par(                                # Set parameters mfrow (matrix frame, specified in rows), mar, and oma.
     mfrow=c(6,6),                  # Set parameters.  Dump 36 plots in a matrix frame of 6 columns and 6 rows.
     mar=rep(1.7, 4),               # Set plot margins to 1.7.  (Repeat 1.7 four times.)
     oma=c(4,4,1,1)                 # Set outer margins are 4,4,1,1 (down, left, up, right).
                                    # See, e,g,. http://research.stowers-institute.org/efg/R/Graphics/Basics/mar-oma/
   )

for ( cr in seq(from=0, to=100, by=20) ) {     # Iterate over all recovery chances, given by Netlogo.
   for ( dr in seq(from=10, to=60, by=10) ) {  # Iterate over all durations, given by Netlogo.

      # It is difficult to create a plot for so many parameters.  We choose to plot for people=100 only.
      # For the present matrix frame, select only those that match cr, dr, and number of starting people=100
      selected <- subset(aggregated, chance.recover==cr & people==100 & duration==dr)
      header <- paste("Cr=", cr, "; Dr=", dr, sep="")
      plot(selected$infectiousness, selected$count.sick.turtles, type="l", main=header, font.main=4)
   }
}

mtext("Infectiousness", side=1, line=2, outer=TRUE) # Set text in lower margin (margin 1), on line 2 outwards.
mtext("Sick humans ",   side=2, line=2, outer=TRUE) # Set text in left  margin (margin 2), on line 2 outwards.

#locator()                          # Uncomment when you want your result in a GUI
dev.off()                           # Uncomment when you want your result dumped (for png, pdf, ...)
-
Here is the generated “Virus Experiment-table.png”:
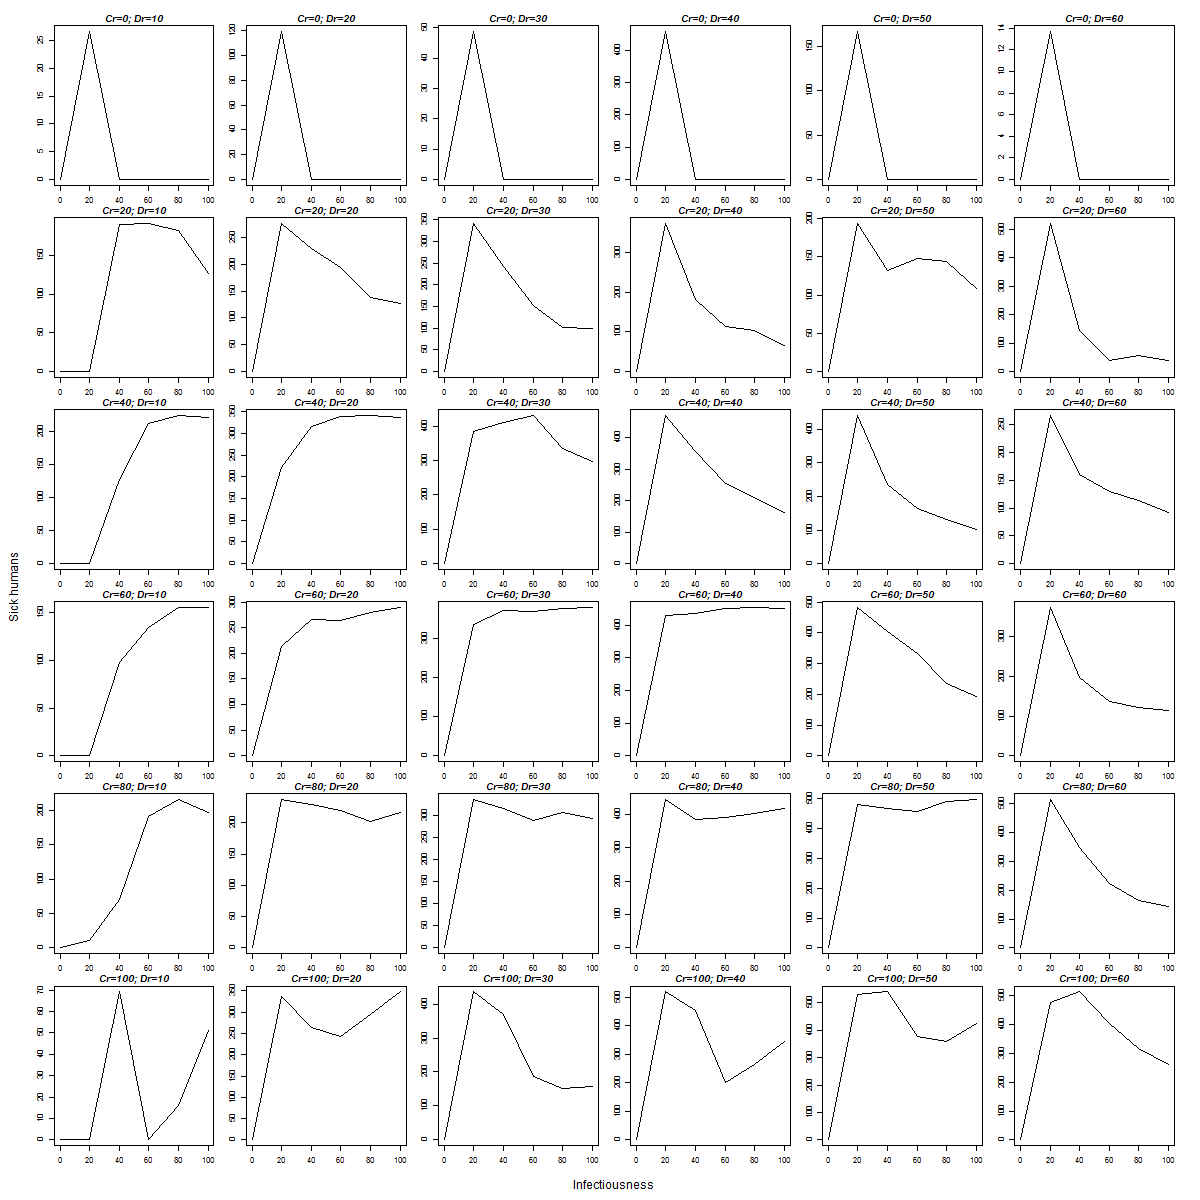
These 36 plots tell us that, in most circumstances, sickness increases with infectiousness, except in extreme conditions, where the dependence is more capricious.
Yes, these plots can be explained much better, but the purpose of this page to explain how to R can deal with results of BehaviorSpace, rather than to perform a painstaking analysis of a Netlogo virus outbreak simulation.
So there you have it. Now go and write your own R scripts. Sure this will not be easy. R has a steep learning curve and many times you will be searching the net for even the most stupid R tasks. But in the end R can do almost anything you want, so it is not so much a matter of possibilities than a matter of persistence and perseverence.
In this page I explained how Netlogo's output can processed by R scripts. But of course there are other ways to couple R and Netlogo. To begin with, just like there are Netlogo extensions for sound, associative arrays, GIS, and video, so is there a Netlogo extension for R, called R-extension.
This extension is further described in Thiel et al.'s article Agent-Based Modelling: Tools for Linking NetLogo and R. Also worth looking at is the RNetLogo package for running NetLogo inside R. However, before adopting such tools I suggest to study the approach explained here first. After that you are in a better position to assess which tools might help you to address your research problem.
For a more general treatment on empirical methods in AI, see Cohen's Empirical Methods for Artificial Intelligence, Walsh's How not to do it, and Beck et al.'s Five pitfalls of empirical scheduling research. Good luck!
Succes! Zie ook:
Translate to en, de, fr, ru, sl, or sk.
This page last modified at Mon, 19 Jun 23 11:19:34 +0200.