Peter Kuipers Munneke
Polar scientist
About me

I am a scientist in the field of glaciology and polar meteorology at the Institute for Marine and Atmospheric research Utrecht (IMAU), part of Utrecht University, The Netherlands. I'm active on Mastodon.
Featured paper: NAO and Greenland firn
The large-scale weather pattern over the North Atlantic is variable, and it impacts Greenland surface mass balance, and firn mass. We find that a more positive phase of NAO (i.e., more zonal flow) since 2012 has slowed down the loss of firn over most of the ice sheet.
Blue ice in Antarctica
Using a spectral unmixing technique, we map daily fractions of blue-ice area over Antarctica for the 22-year period since 2000, using the full available MODIS archive. This FABIAN product is published in Remote Sensing of Environment.
How much meltwater would you like?
Extensive melt ponds are not a very common sight on the cold Antarctic continent. Not yet, at least. According to our new study, appearing on 12 October in Nature Geoscience, the amount of snowmelt could grow eightfold by 2100 if current greenhouse gas emissions are not sufficiently curbed, with potentially dire consequences for the stability of large ice shelves, and the contribution of the Antarctic ice sheet to sea-level rise.
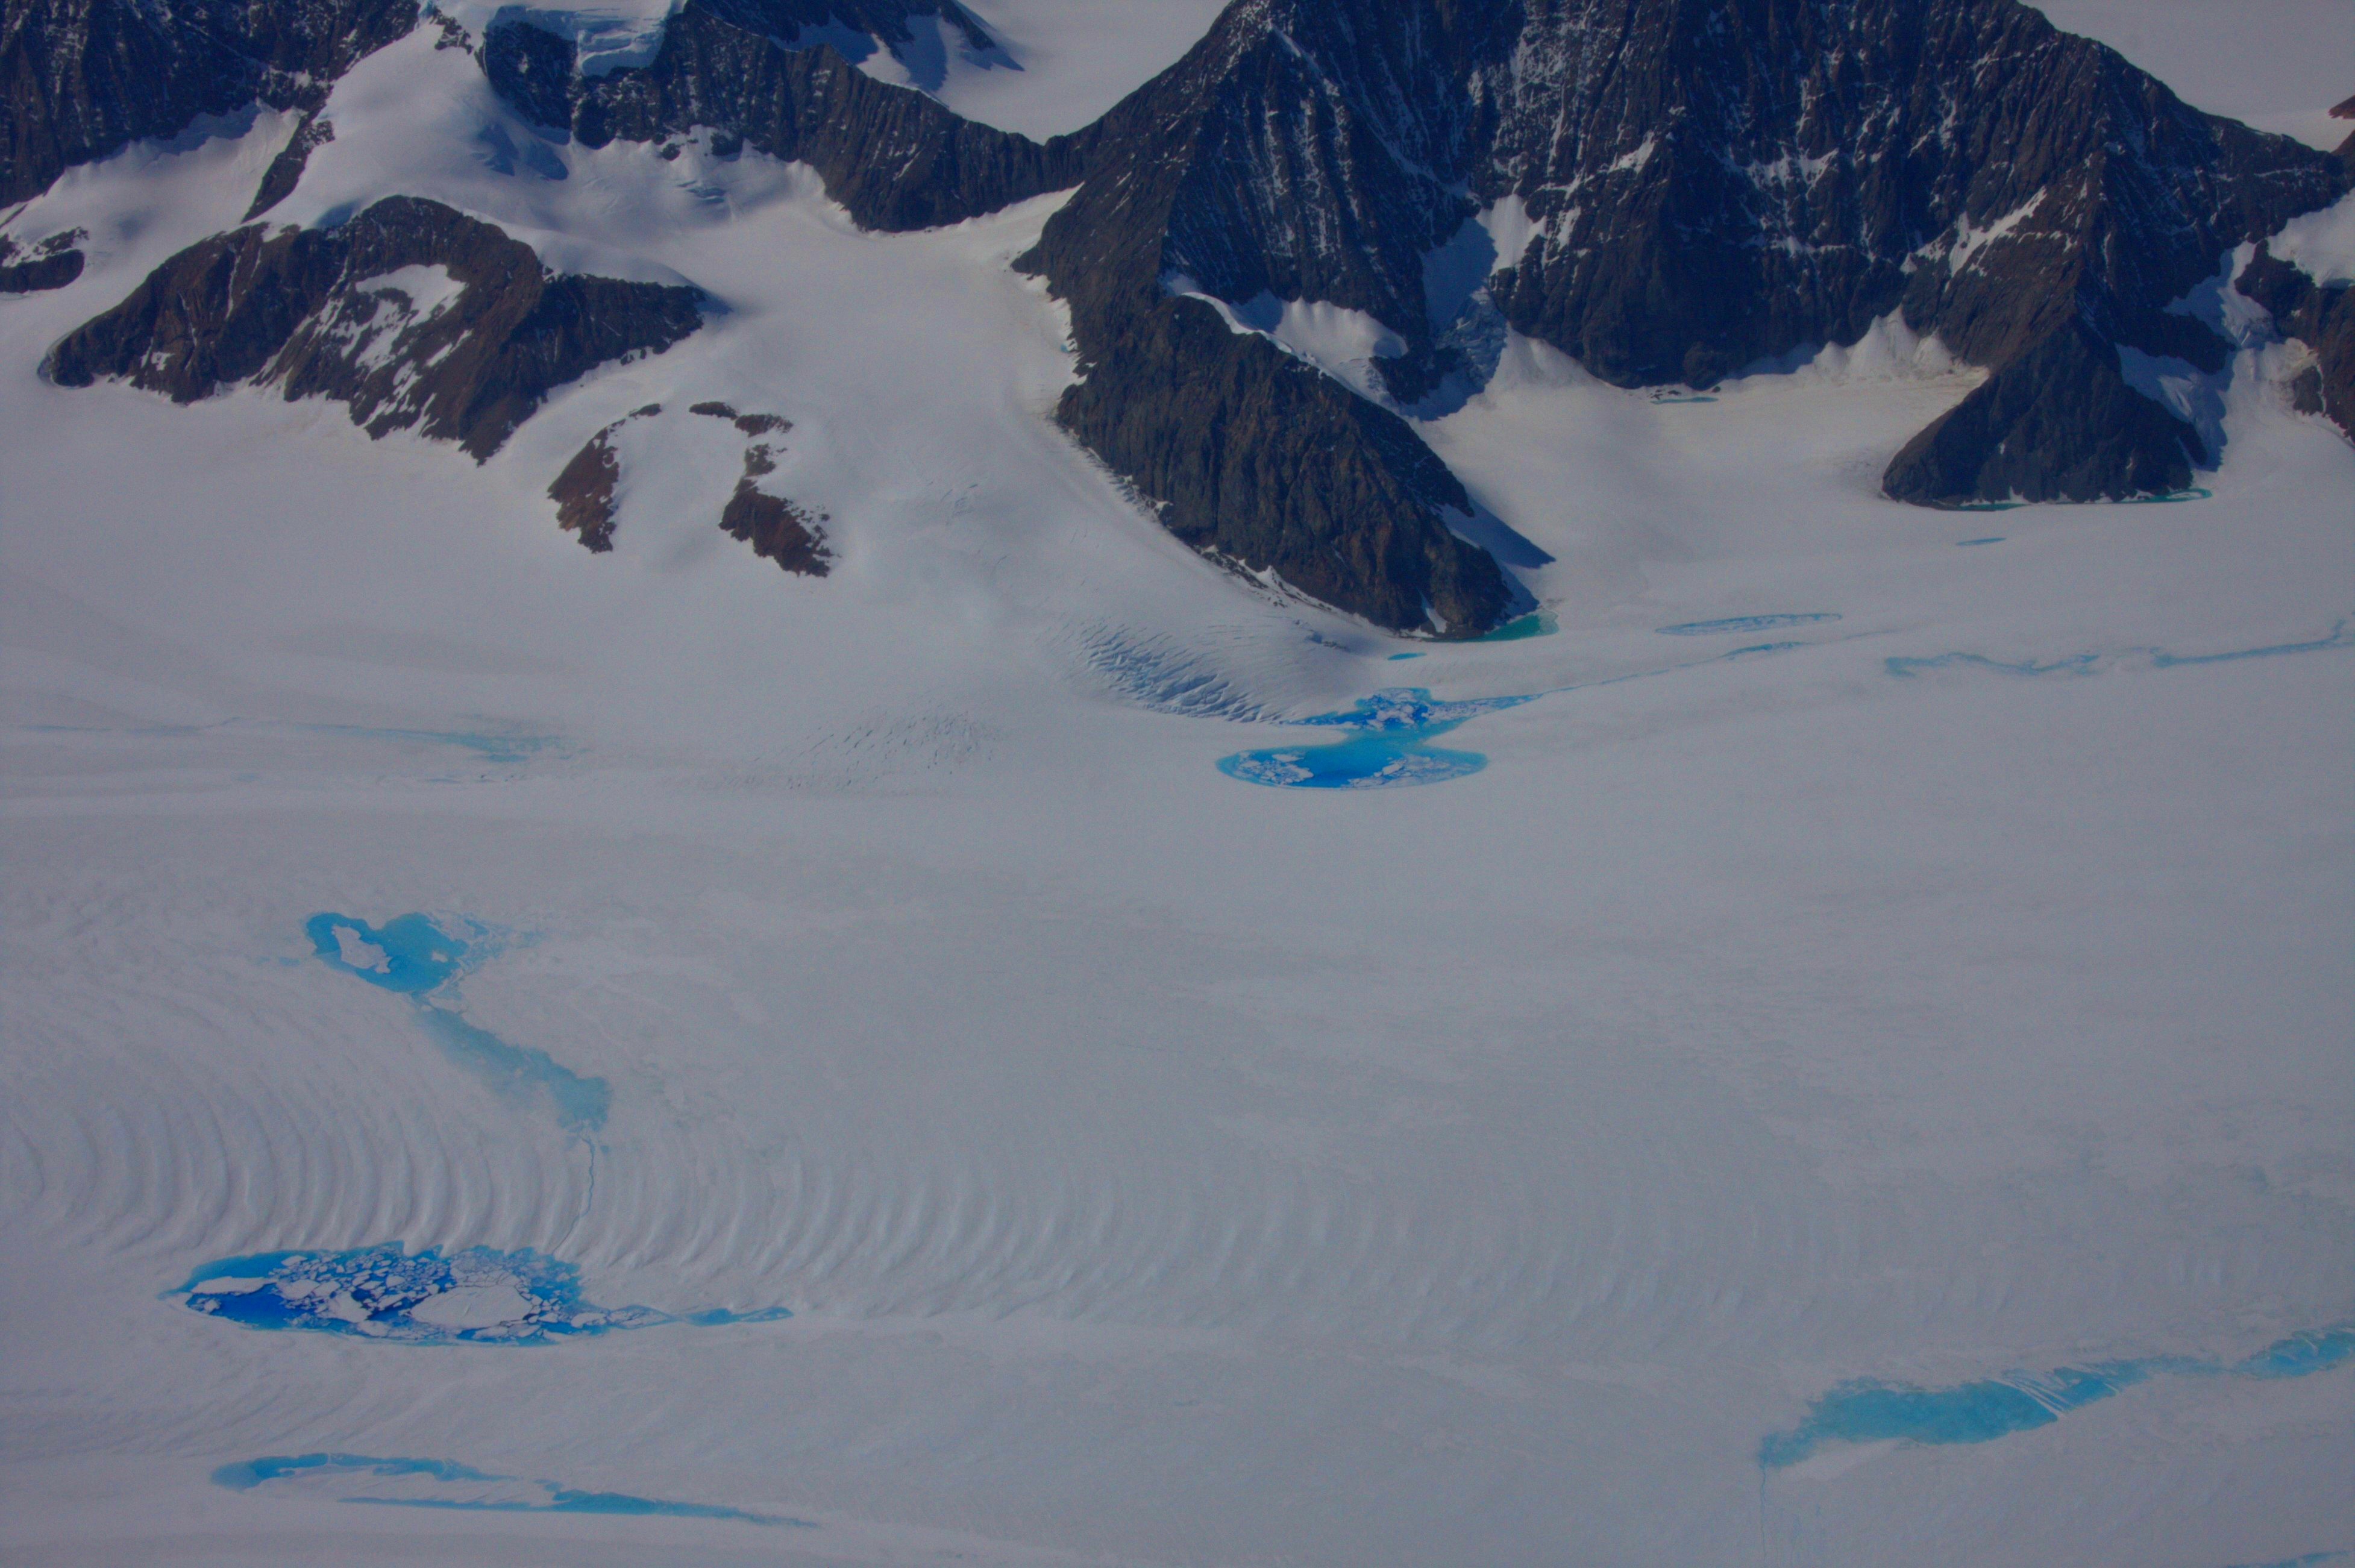
Melt ponds on Larsen C ice shelf. Photo by Martin Truffer (Univ. Alaska)
Warmer oceans...
Since the last two or three decades, the Antarctic ice sheet is losing mass. The amount of snowfall on the ice sheet no longer compensates for the retreat of glaciers and the shedding of icebergs at the margins of the continent margin. Most of the mass loss is concentrated around a few glaciers in West Antarctica that have been identified as "weak spots" of the ice sheet. Warming ocean waters erode colossal ice bodies like Pine Island and Thwaites glaciers from below as they flow onto the open ocean as floating ice shelves. Their bottom melting triggers an inland thinning and retreat that some researchers suggest to be irreversible.
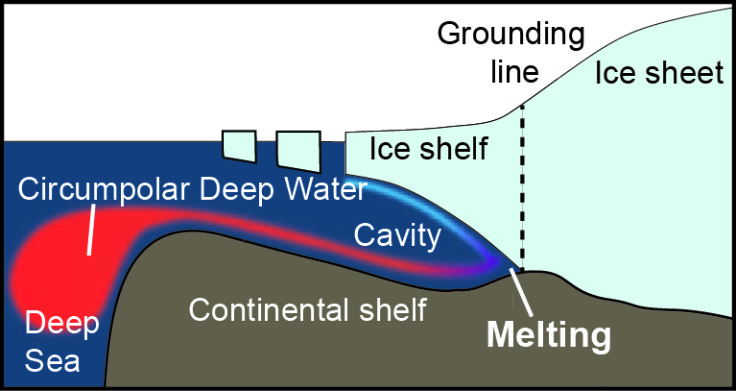
Warming ocean water eroding the Antarctic ice shelves from below. Picture taken from British Antarctic Survey (James Smith).
... and a warming atmosphere
Another sizeable Antarctic contribution to rising sea levels is the Antarctic Peninsula, a spine of towering mountains that stretches out north from the continent towards South America. These mountains capture massive amounts of snow, creating giant glaciers that end in floating ice shelves on both sides of the mountain range, some the size of The Netherlands (or Wales, for the anglophone reader). Since the 1960s, about 20% of the ice-shelf area has been lost, with major collapses of the Larsen A Shelf in 1995 and the Larsen B in 2002 as landmark events of this decline. After their disappearance, glaciers previously feeding the ice shelves accelerated by a factor of 3 or 4, strongly increasing the share of the Peninsula in the mass loss of Antarctica.
Many researchers, including myself, have argued in several papers that an increase in snowmelt has played a pivotal role in the collapse of the ice shelves. The snow overlying the shelves normally acts as a sponge, absorbing the water from melting snow, and letting it refreeze in its air pockets. When melt increases, the snow sponge loses its absorption capacity, and instead, meltwater collects in ponds at the surface. The pressure of the ponds and the water that flows into cracks and fissures eventually leads to a complete rupture of the shelf, shattering it into innumerable icebergs.
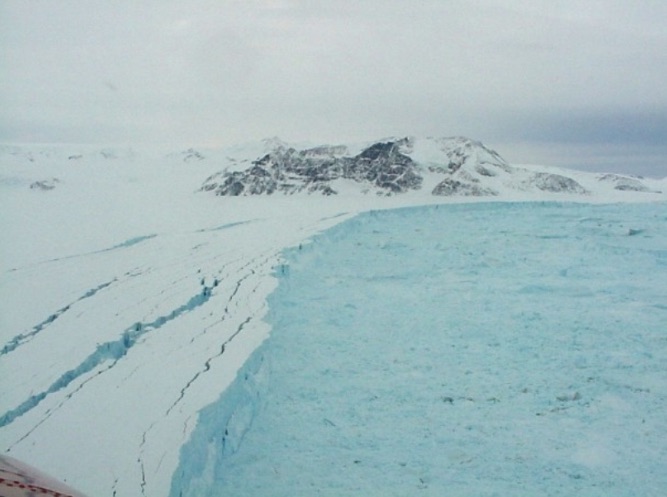
Larsen B ice shelf in March 2002 during collapse. Photo from Cook and Vaughan (2012), photo by S. Tojeiro.
Future snowmelt
In our new study, led by American glaciologist Luke Trusel from Woods Hole Oceanographic Institution, we find that snowmelt in Antarctica is projected to increase in the coming century, exposing additional ice shelves to melt ponding, and to the risk of collapse. However, we find large differences in the projected amount of snowmelt for different future greenhouse gas emission scenarios. This is due to the strongly non-linear relation between temperature and melt. Therefore, under a moderate emission scenario (in which emissions are reduced from 2040 onwards), the amount of snowmelt doubles until 2050, after which it remains essentially constant throughout the rest of the 21st century. However, under a business-as-usual, carbon-intensive future scenario, the amount of snowmelt in Antarctica grows eightfold. A few large ice shelves, for example the Larsen C ice shelf in the Antarctic Peninsula, will see levels of snowmelt that have been associated with the collapse of its counterparts, Larsen A and B ice shelves.
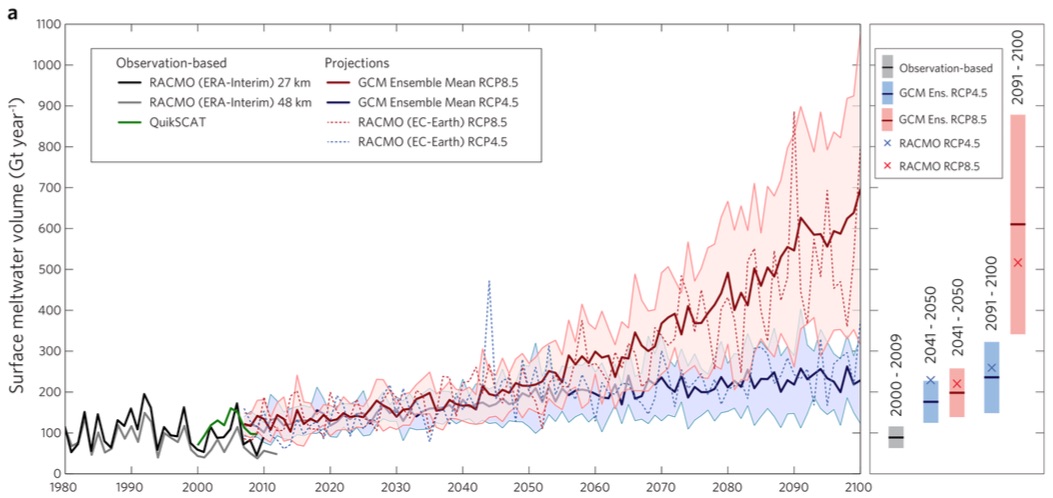
Present-day melt (black, gray and green lines) and future projections for moderate emission reduction (RCP4.5, blue line with range) and no emission reduction (RCP8.5, red line with range). Graph from Trusel et al. (2015).
We show that the amount of snowmelt in Antarctica is very much a choice that we have now, by choosing whether to reduce carbon emissions or not. Successfully curtailing emissions reduces the number of ice shelves at risk of collapsing. But whether these emission reductions also put a halt to the erosion of the Antarctic ice sheet by warming ocean waters, remains a question open for answer by glaciologists and oceanographers around the world. We simply cannot answer this question with sufficient certainty. Studies assessing the role of the ocean in different emission scenarios, like we did for the atmosphere, are now more urgent than ever.
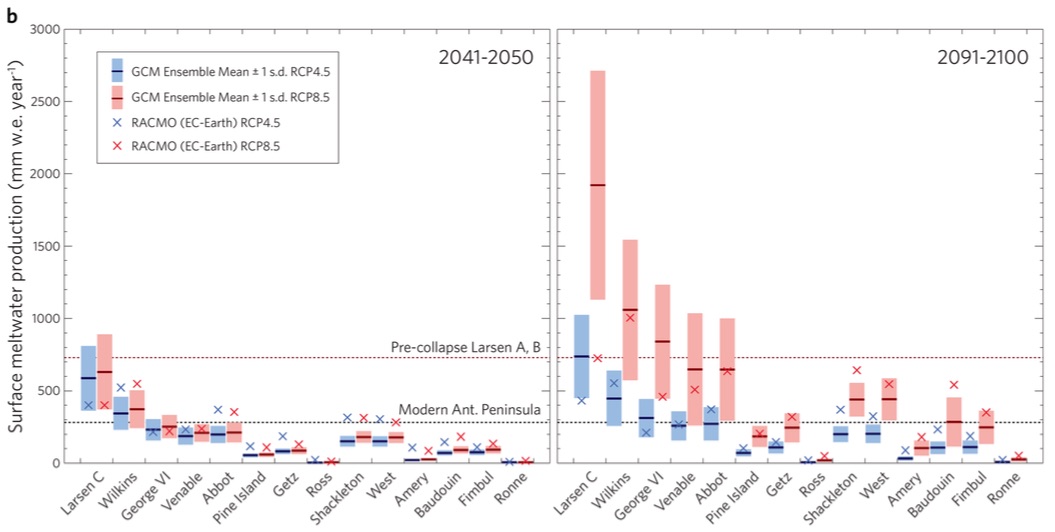
Future melt on several ice shelves. Left panel shows melt for 2041-2050, right panel shows the same for 2091-2100. Blue bars indicate the range for moderate emission reduction (RCP4.5), and red bars the range for the no-reduction scenario (RCP8.5). Graph from Trusel et al. (2015).
This research appeared in Nature Geoscience on 12 October 2015: L. D. Trusel, K. E. Frey, S. B. Das, K. Karnauskas, P. Kuipers Munneke, E. van Meijgaard and M. R. van den Broeke. 2015. Divergent trajectories of Antarctic surface melt under two 21st century climate scenarios. Nature Geosci., doi:10.1038/NGEO2563. This research was financed by NASA, and the Netherlands Polar Programme. Researchers from Woods Hole Oceanographic Institution, KNMI, and the IMAU contributed to this article.