Carleen Tijm-Reijmer
Polar Meteorology, Utrecht University
"Yesterday is History, Tomorrow a Mystery, Today is a Gift, Thats why it's called the Present"
Research
Over the years I worked on varies projects. Below are summaries of finished and still ongoing work.
Automatic Weather Stations
The relation between meteorological quantities and the mass balance of a glacier surface is a critical element in modelling the reaction of different glaciers to climate change. To get a better hold on the processes that determine this interaction, IMAU deployed several automatic weather stations (AWS) on glaciers, ice caps and ice sheets. At present about 15 stations are operational world wide of which about 10 on the Antarctic continent. The figure illustrates the current type of AWS in use. At present IMAU technicians are working on a new, low power AWS, the iWS. The stations have proven to be very reliable and data are published in numerous publications by IMAU researchers. Further information on the AWS project can be found on the AWS project site.
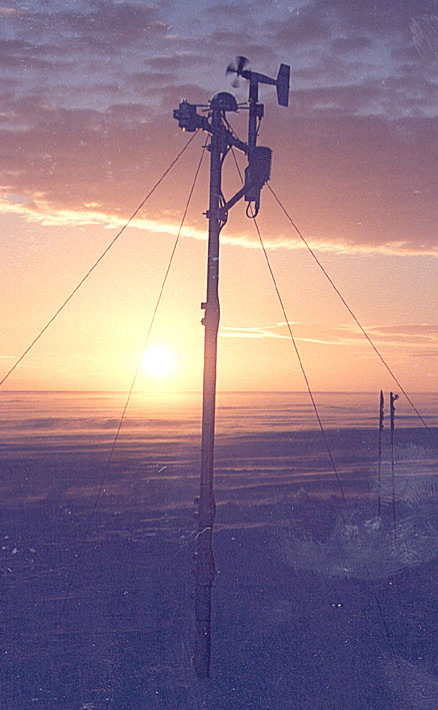
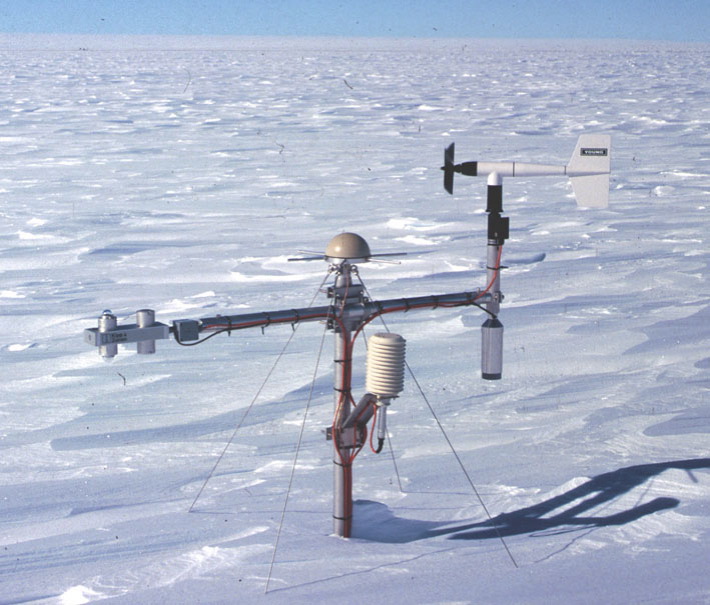
IMAU AWS on Antarctica. Left AWS 4 at installation in february 1998, right the station 2 years later.
Back to topRegional Climate Modelling
We use the Regional Atmospheric Climate Model RACMO2 to study the climate and mass budget of Antarctica, Greenland and other ice caps such as Svalbard and the Canadian Arctic. RACMO2 is developed by the Royal Netherlands Meteorological Institute (KNMI) and combines the dynamics description of the High Resolution Limited Area Model (HIRLAM) with the physics description of the European Center for Medium-range Weather Forecast (ECMWF) model. We made adjustments to the physics in order to improve the performance of the model over glaciated regions. These changes include the implementation of a multi layer snow model that includes water percolation and refreezing, the inclusion of a sophisticated snow albedo scheme, and scheme describing snow drift transport and sublimation. The horizontal resolution of the model has improved over the years from ~55 km to at present 5.5 km due to the increased computer capacity. The boundaries of the model are prescribed from global models such as the 45-year re-analysis of the ECMWF (ERA40), the ERA-Interim re-analysis product or from GCMs for paleoclimate studies and future scenarios.
Back to topGlacier melt and ice velocity
Within the framework of the International Polar Year effort the dynamic response of Arctic glaciers to global warming (GLACIODYN) mass balance and velocity observations were carried out on several glaciers and ice caps on Svalbard: Nordenskiöldbreen, an outlet glacier of the Lomonosovfonna ice field; Kronebreen, an outlet glacier of Holtedahlfonna; and Duvebreen and Basin no3, two outlet glaciers of the Austfonna ice cap. The data are used to study the link between the observed ice velocities and (melt) water availability. The time series of ice velocity show an increase of velocity in the melt season linked to increasing melt water availability. The figure shows an example for Kronebreen.
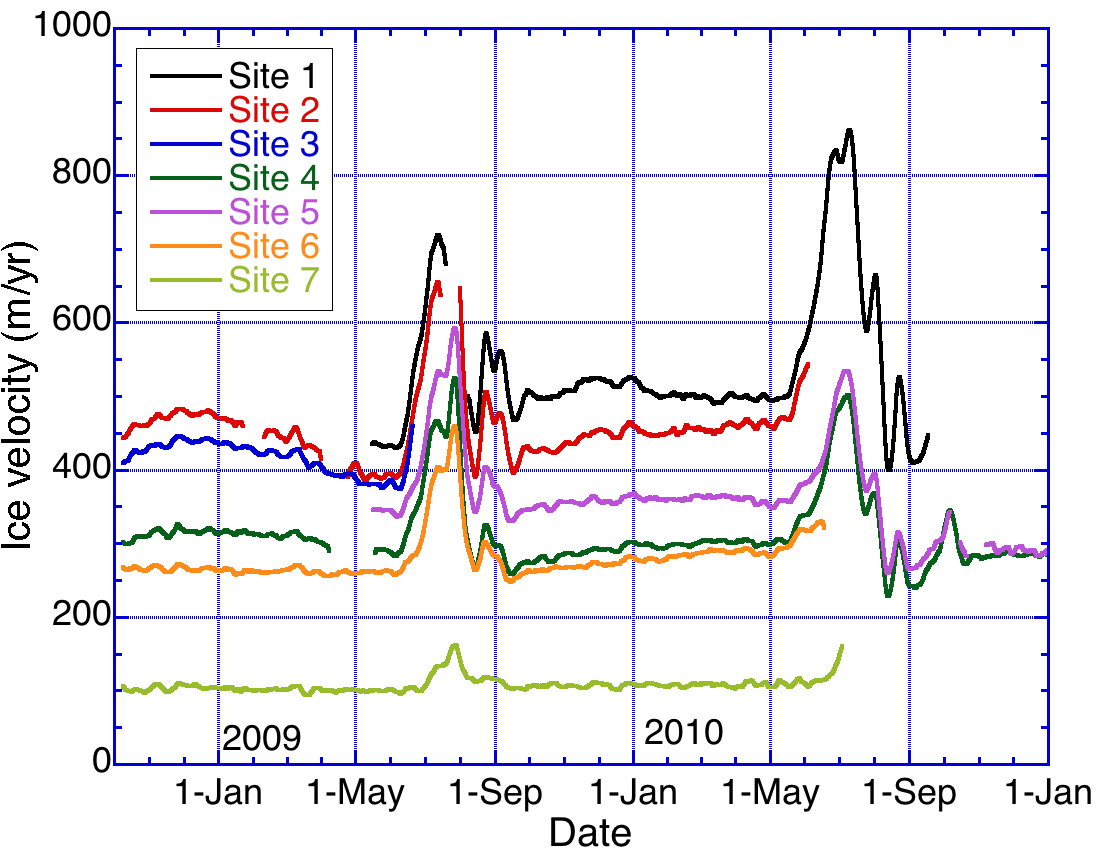
Ice velocity along the flow line of Kronebreen, Svalbard. Site 1 is located closest to the glacier front.
Back to topDistributed energy and mass balance modelling
The distributed energy and mass balance model is a grid-based model which calculates all components of the surface energy and mass balance for a given time interval and each glacier gridcell, based on meteorological data collected on or near the glacier. The model is coupled to a multi-layer snow model that describes the temperature, density and water-content evolution of the snow/ice pack and includes the processes of percolation and refreezing of water. The example below shows the calculated mass balance for Storglaciären, Sweden based on model calculations ove the period 9 May-2 September 1999.
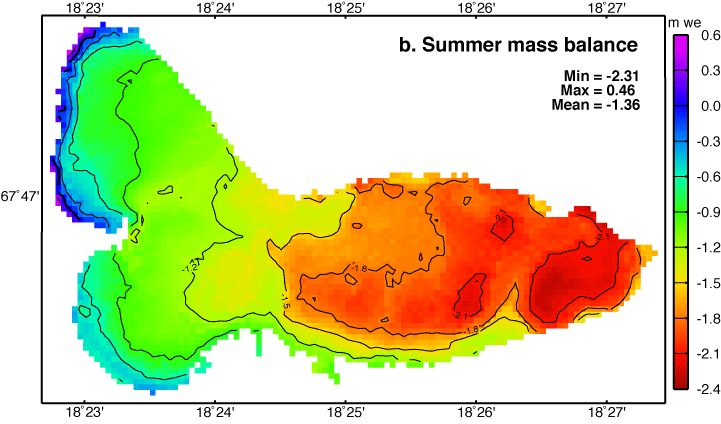
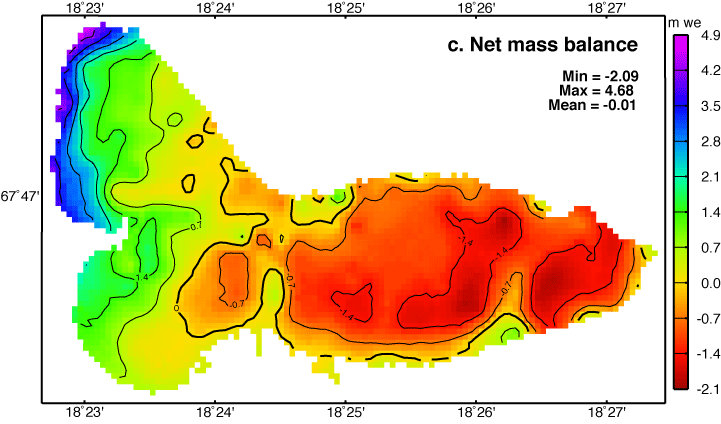
a. Modelled summer mass balance. b. net mass balance based on (a) and the winter balance 1998-1999 based on observations.
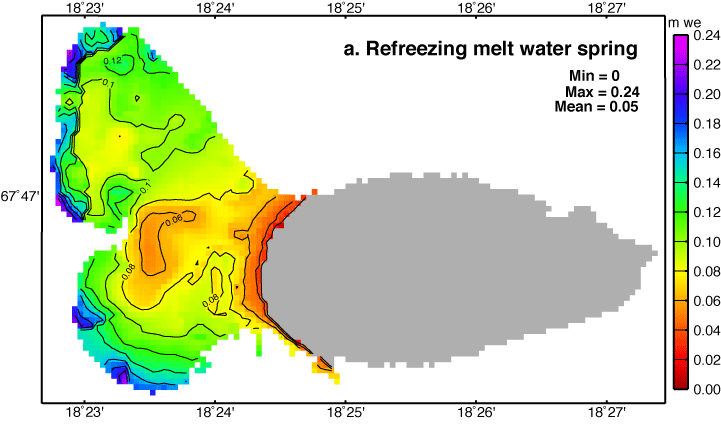
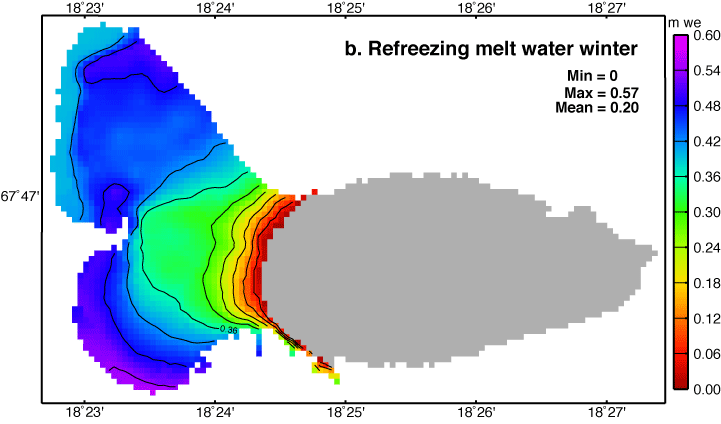
Modelled internal accumulation. a. The total amount of water refrozen in spring. b. the irreducible water content at the end of the model run. In the grey area internal accumulation is zero.
Back to topTrajectories to determine moisture source regions
A problem in the interpretation of temperature records from ice cores is the separation of the local climatological signal in the record from a signal advected by the moisture that forms the snow. A first step is to determine the source region of moisture. This can be done by studying the pathways, or trajectories, along which air parcels transport moisture. Below is an example of trajectories averaged over 15 years for 5 deep drilling sites on the Antarctic continent, and for 6 different arrival levels above the surface, for those cases with snowfall at the point of arrival.
More recent studies combine moisture histories along trajectories, measured and analysed accumulation events, with diffusion models in order to reproduce the measured isotope content of snow over Antarctica and study its dependence on temperature.
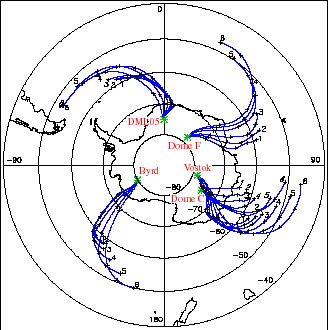
Mean 5-day backward snowfall trajectories starting at six different pressure levels above the surface (highest level is 6).
Back to topRemote sensing of snow and ice surfaces
The mass balance of glaciers is to a large extend determined by the summer energy balance. Solar radiation provides by far the most energy for melting and since the surface albedo controls the amount of absorbed solar radiation, the albedo is a key parameter in estimating glacier melt. Due to the variability of the ice albedo in situ observations need not be representative for an entire glacier. Satellite remote sensing is a good alternative to overcome that problem. Previous studies suggest that differences between ground and satellite measurements are caused by the different field of view of the instruments in combination with the scale of surface variations. In this study we derived the surface albedo from different satellite instruments with different pixel size and compared them with in situ observations. The figure below shows an example for the Vatnajökull ice cap on Iceland. At present, spatial resolution of satellite instruments have improved and satellites such as MODIS offer direct albedo products on reasonable high resolution.
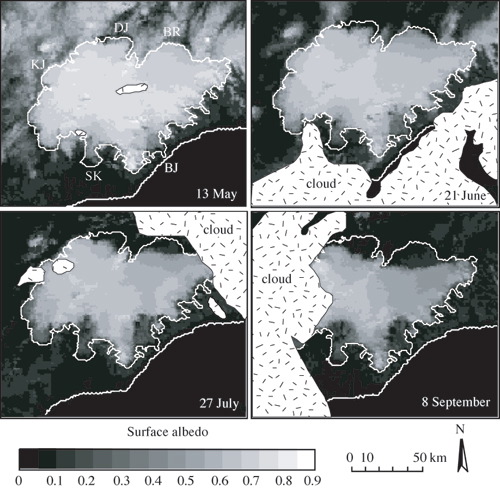
a. Satellite-derived surface albedo of the Vatnajökull ice cap (1996). Marked areas are regions with possible cloud cover. b. Satellite-derived and in-situ measured surface albedo.
Back to top